Temperatures from January to April


The graphs from January to April show a general increase in temperature throughout the early part of the year from winter to spring. It's also interesting to note that in April, temperatures seemed to steady off at least somewhat. You can see an extreme cold snap that we experienced during the month of January, clearly represented on the graph. Overall, most of the temperature data on the graphs matched up well with my weather blog and the data I received, especially during the months of January and February when we experienced so many crazy cold snaps.
Precipitation from January to April


The graphs above show the precipitation that we experienced throughout the first few months of the year, including rain and snow. You can see several correlations here with my blog posts, especially during the months of January and February where we had the huge snow storms in Eau Claire. More or less, I saw precipitation matching more with wind direction than temperature. That is to say that the wind direction affected the precipitation that we had more often than the temperature. I see a few trends here in precipitation, one being that we seemed to get more in the middle of the month than towards the beginning or end.
Dominant Wind Direction from January to April
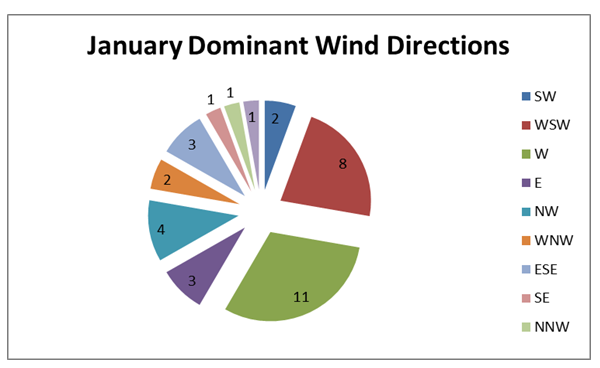


Above are some pie graphs depicting the dominant wind directions that we experienced from January to April. As stated earlier, I saw some strong correlations between wind direction and the amount of precipitation we had. For example, the most dominant wind directions during the colder months of the year came from the northwest, bringing colder temperatures and snow. In the spring months, we experienced more rain than anything, and wind directions seemed to shift to the south as well, though wind from the west was also dominant.
Overview
I feel as though my weather blog from the semester correlated strongly with the data analysis that I have presented here. It was an awesome experience to get out each day and note the conditions outside, and it really helped me to notice some strong trends this year that we have not experienced in other years. It has been much cooler this year than other years, for example, and we had a ton of precipitation, at least more than I can ever remember having in the past. The project was also great because it helped me to learn more about the weather around me than just knowing the temperature each day.